

Ja Morant and the Grizzlies (10-10) are 9th in the West standings.
Each week during the season, NBA.com writer John Schuhmann surveys the league to compile stats and notes for his in-depth Power Rankings. Before the next rankings drop on Monday, here are some of the storylines he’s keeping an eye on this weekend.
1. What the Standings Don’t Tell Us
With apologies to Bill Parcells, a team’s record doesn’t tell us the whole story.
On Wednesday, we passed the 1/3 mark of the season, with 368 of 1,080 games played. We’ve learned from history that a team’s record after 20 games can tell us a lot. In the 20 full (82-game) seasons from 1997-98 to 2018-19, 92% of the teams that won at least 12 of their first 20 games made the playoffs. On the other end of the spectrum, only 9% of teams that won fewer than eight of their first 20 games would go on to reach the postseason.
But this season is unique in a number of ways. And beyond the pandemic-related issues, the playoff system is different. Instead of a hard cut-off after the top eight teams in each conference, there’s a cut-off after the top six (those that automatically qualify for the playoffs) and another after teams 7-10 (aka “the Play-In Club”).
Through Wednesday’s games, the Eastern Conference has the 11th-place Miami Heat within a game and a half of the Toronto Raptors, who are suddenly in fifth place with a 12-13 record. In the West, only two and a half games separate the fifth-place Blazers (13-10) from the 13th-place Houston Rockets (11-13).
To help us delineate one team hovering around .500 from another, we can look at a handful of numbers that might tell us just how real their record is:
- Point differential – A team with a lot of narrow losses and bigger wins might be better than their record says.
- Strength of schedule – If a team has played a relatively tough schedule, they could be in for better results in the future.
- Opponent 3-point percentage and free throw percentage – These numbers can be random, and if a team has been unlucky in how well their opponents have shot from deep or from the line, their defense may be better than currently ranked.
- Health – If the team’s best players have missed a bunch of games, they could be much improved when healthy.
(* There’s some overlap between the second and third items above. If you’ve played a tougher schedule, you’ve probably played the better shooting teams.)
To get a better idea of which teams might be due for a surge and which records might be a tad inflated, we ranked them all in regard to the four factors above and totaled those rankings up.
For health, we looked at games missed by the team’s top eight players in minutes per game, weighted for the top four (so a Karl-Anthony Towns absence counts more than a Mike Scott absence). Players out for the season (i.e. Spencer Dinwiddie) were not counted, because they wouldn’t affect future performance. Players who haven’t played yet, but will likely be in the top eight when they do (i.e. Jaren Jackson Jr.) were counted.
Better than they seem?
Here are the 3 teams showing the most signs that they’re better than their record:
1. Indiana (12-13) – T.J. Warren has played in just four games, and Caris LeVert has yet to play for his new team. The Pacers rank 25th in opponent 3-point percentage, so they could see better results going forward. Their point differential says they should have one additional victory and they’ve played one of the league’s 10 toughest schedules. Their game in Detroit on Thursday is the start of five straight against teams no better than the 11-13 Hawks and Rockets.
2. Detroit (6-18) – The Pistons have the league’s second worst record, but they’ve played its toughest schedule (they have wins over the Celtics, Suns, Sixers, Lakers and Nets) and they have the point differential of a team that’s 8-16. They’re 2-12 in games that were within five points in the last five minutes and 4-6 otherwise.
3. Memphis (10-10) – The Grizzlies have played the league’s sixth toughest schedule and have had some bad luck with opponent shooting, ranking 28th in opponent 3-point percentage. They’ve also been without Jackson for the entire year and Ja Morant for eight of their 20 games.
The next three: Denver (second toughest schedule, two fewer wins than their point differential would indicate), Minnesota (Towns has played in just five games, relatively tough schedule), and Dallas (tough schedule, health issues).
Not that good?
Here are the 3 teams showing the most signs that they’re not as good as their record:
1. Utah (20-5) – The Jazz have established themselves as a contender, but have been fortunate in regard to health, with just 10 total games missed from their top eight guys. They rank fifth in opponent 3-point percentage and have played one of the league’s 10 easiest schedules, with 15 of their 25 games having come against teams that currently have losing records.
2. L.A. Lakers (20-6) – The Lakers rank third in opponent 3-point percentage, so we could see some slippage from that No. 1 defense at some point. They’ve been very healthy and have played a relatively easy schedule, with 16 of their 26 games having come against teams that are currently at or below .500.
3. Orlando (9-16) – We’re not counting injuries to Markelle Fultz and Jonathan Isaac, because those guys aren’t coming back this season. The Magic have had injury issues beyond those two, but they’ve played the league’s second easiest schedule and have the point differential of a team that’s 6-19.
The next three: Philadelphia (league’s easiest schedule to date), and Phoenix (relatively easy schedule, luck with opponent shooting), New York (first in opponent 3-point percentage, sixth in opponent free throw percentage), and Oklahoma City (10-14, with the point differential of a team that’s 7-17).
2. Sixers’ Starters Sweet Shooting
With their win in Sacramento on Tuesday, the Philadelphia 76ers are 14-0 when they’ve had their full starting lineup. When one or more of their five starters has been out, the Sixers are 4-7, with the most recent of those losses having come last Thursday, when, playing without Ben Simmons, they lost at home to the Portland Trail Blazers, who were without Damian Lillard.
Overall, the Sixers have been better on defense (where they rank second) than on offense (13th). But that starting lineup has rather potent offensively.
- Thursday on TNT: 76ers vs. Blazers (10 ET)
The 120.1 points per 100 possessions that the Sixers’ starting lineup has scored ranks third among 23 lineups that have played at least 100 minutes this season. It has the second highest turnover rate among the 23 (15.6 per 100 possessions), but the second highest free throw rate (33.1 attempts per 100 shots from the field) and, most important, the highest effective field goal percentage (60.8%).
Interestingly, where the Sixers’ starting lineup has been most potent is outside the paint. On shots from outside the paint, the league average effective field goal percentage is 51.9%, while the Sixers’ starting lineup’s is 64.1%. The lineup has shot 42-for-77 (54.5%) from mid-range and 78-for-171 (45.6%) from 3-point range, including 25-for-50 (50%) on corner 3-pointers.
Sixers’ shooters from outside the paint with the starting lineup:
| FGA | eFG% | |
| Seth Curry | 74 | 75.7% |
| Danny Green | 59 | 58.5% |
| Tobias Harris | 49 | 70.4% |
With other lineups:
| FGA | eFG% | |
| Seth Curry | 44 | 45.5% |
| Danny Green | 109 | 48.6% |
| Tobias Harris | 111 | 52.7% |
Those numbers are likely unsustainable. But the shooters obviously benefit from Ben Simmons (who leads the league with 97 assists on 3-pointers) bending the defense with his pushes in transition and from Joel Embiid drawing attention in the post.
The Sixers also avoid stagnation. They rank seventh in ball movement (350 passes per 24 minutes of possession), having seen the fifth biggest jump from last season (333, 14th). They’re in the middle of the pack in regard to player movement (11.2 miles traveled per 24 minutes of possession, 18th), but have seen an increase there as well.
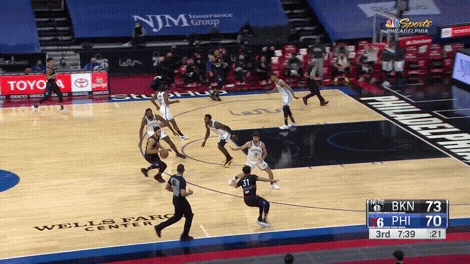
And with that starting group, there can be a clear intention of moving the ball from side to side. Here, as the ball moves to the left side of the floor and Harris comes out of the corner for a handoff from Embiid, Green clears to the right side, removing a defender and giving Embiid a clear roll to the rim …
The Sixers’ four-game trip only gets tougher as it goes. They’ll have an opportunity for revenge against the Blazers in Portland on Thursday (10 p.m. ET, TNT). They’re in Phoenix on Saturday (3 p.m. ET, NBA TV) and complete the trip in Utah on Monday (9 p.m. ET, League Pass).
3. Rockets Still Stagnant
It was noted in this week’s Power Rankings that the Brooklyn Nets had, not surprisingly, seen drops in ball and player movement since acquiring James Harden. But on the other side of that trade, the Houston Rockets haven’t exactly turned into the 2014 Spurs.
At the time of the trade (through Jan. 13), the Rockets ranked 27th in ball movement (313 passes per 24 minutes of possession) and last in player movement (10.4 miles traveled per 24 minutes of possession). They have seen increases in both, but since Jan. 14, they rank just 23rd (317) and 28th (10.8).
The Rockets have a couple of guys – David Nwaba and Jae’Sean Tate – who play with a ton of energy, but there can still be some standing around in their offense. This was an after-timeout possession in their ugly loss in Charlotte on Monday …

Houston hasn’t had much continuity. Since Victor Oladipo made his Rockets debut on Jan. 18, only Tate, DeMarcus Cousins and P.J. Tucker have played in all 13 of their games. John Wall and Oladipo have played just 102 minutes together and just 53 minutes with Christian Wood, who’s currently out with an ankle injury. So it’s understandable that guys aren’t yet on the same page.
It can’t be forgotten that the Rockets rank fourth defensively, second (105.8 points allowed per 100 possessions) since the Harden trade. But their last two games (losses in Charlotte and New Orleans) have been their two worst defensive games of the season (126 per 100 allowed over the two games), and if you’re looking for a free-flowing offense unencumbered from Harden’s isolation game, you may have to wait a while.
The Rockets should have both Wall and Oladipo in the lineup when they host the Heat on Thursday (7:30 p.m. ET, TNT).
4. LaMelo Plays it Safe
LaMelo Ball takes some chances with his passing. Late in the first quarter of their win over Houston on Monday, the not-so-mobile DeMarcus Cousins was able to leave his man and easily intercept a lob pass from Ball to Miles Bridges. In the fourth quarter, the Hornets ran the same play and Ball was able to squeeze the pass between Tate and Mason Jones …

But later in the fourth, as the Hornets were blowing the game open, Ball showed a little more caution. Bismack Biyombo was running free down the right side of the floor, but Ball waited until Biyombo (only 28, but not quite as explosive or coordinated as Bridges) had both feet under him before tossing a more cautious lob …

Perhaps Ball was a little more prudent in that situation because he was looking for assist No. 10.
5. Most Prolific Assist Combinations
Ball’s 31 assists to Bridges (watch them all here) are the most he has to a single teammate (he also has 30 to Gordon Hayward), but aren’t enough to crack the top 25 in regard to most assists from one player to a single teammate. Here’s the top 15, headlined by a pairing featured in this space last week, along with the rate of assists per 36 minutes on the floor together:
Most assists from one player to a single teammate, 2020-21
| Scorer | Assisted By | AST | MIN | Per 36 |
|---|---|---|---|---|
| Stephen Curry | Draymond Green | 59 | 589 | 3.6 |
| John Collins | Trae Young | 56 | 586 | 3.4 |
| Domantas Sabonis | Malcolm Brogdon | 48 | 789 | 2.2 |
| Jaylen Brown | Marcus Smart | 47 | 486 | 3.5 |
| Deandre Ayton | Chris Paul | 46 | 622 | 2.7 |
| Tobias Harris | Ben Simmons | 45 | 545 | 3.0 |
| Clint Capela | Trae Young | 45 | 461 | 3.5 |
| Tim Hardaway Jr. | Luka Doncic | 43 | 540 | 2.9 |
| Anthony Davis | LeBron James | 43 | 486 | 3.2 |
| RJ Barrett | Julius Randle | 40 | 778 | 1.9 |
| Malik Beasley | D’Angelo Russell | 40 | 440 | 3.3 |
| Jerami Grant | Delon Wright | 40 | 600 | 2.4 |
| Kristaps Porzingis | Luka Doncic | 39 | 306 | 4.6 |
| Jamal Murray | Nikola Jokic | 39 | 643 | 2.2 |
| Giannis Antetokounmpo | Khris Middleton | 39 | 588 | 2.4 |
MIN = Minutes on the floor together
Per 36 = Assists per 36 minutes on the floor together
* * *
John Schuhmann is a senior stats analyst for NBA.com. You can e-mail him here, find his archive here and follow him on Twitter.
The views on this page do not necessarily reflect the views of the NBA, its clubs or Turner Broadcasting.


