

After a surprising 7-5 start, the Los Angeles Lakers have regressed to the level they were playing at the last few seasons. They’re 4-15 since those first 12 games and have lost 10 of their last 11. They have the 26th ranked offense and 30th ranked defense in the month of December, and are the only team with only one win this month.
There are still plenty of reasons for Lakers fans to feel good about what is transpiring. The team has a more clear direction than it’s had in the past three years, the young talent is abundant, and injuries played a part in the regression over the last four weeks. But after that early run where it looked like the Lakers had taken a huge step forward, the growing pains have been felt.
The Basics – Los Angeles Lakers (11-20)
Pace: 101.1 (4th)
OffRtg: 103.2 (19th)
DefRtg: 109.8 (29th)
NetRtg: -6.6 (28th)
Lakers links: Team stats | Player stats | Player shooting | Lineups
Still, the Lakers are just two games behind the eighth-place Portland Trail Blazers in the Western Conference. Starting with their Christmas Day game against the Clippers, they’ll play 11 of 14 games at home. They have three games against those Blazers in January, and the last two games of their current, seven-game trip are winnable.
The first game of their Florida back-to-back is in Miami, where the Lakers will visit the 9-20 Heat as part of TNT’s Thursday double-header (8 p.m. ET).
Here are a few numbers to know about the Lakers’ first 31 games …
No. 1
Lakers starters have an aggregate NetRtg of minus-11.0, the worst mark in the league.
A player’s (or lineup’s) NetRtg is his team’s point differential per 100 possessions while he’s on the floor. The starters’ aggregate NetRtg is the average NetRtg for players that start a game, weighted by minutes played.
That the Lakers’ starters have the league’s worst aggregate NetRtg (by a wide margin) doesn’t jive with the fact that their most used starting lineup – D’Angelo Russell, Nick Young, Luol Deng, Julius Randle and Timofey Mozgov – has outscored its opponents by 3.1 points per 100 possessions. That lineup has been very good offensively.
In fact, each of the Lakers’ five most-used lineups have a positive NetRtg. L.A. has a five-man, bench unit that has the 15th best NetRtg among 44 lineups that have played at least 100 minutes together this season.
But this is a team that has been outscored by 188 points this season, which tells you how much injuries have derailed what the Lakers had going through the first three weeks. If they could have kept those two successful lineups together, they might be in playoff position right now.
The dropoff started with an injury to point guard D’Angelo Russell, who has missed 13 games. In Jose Calderon’s nine games as a starter, the Lakers were outscored by 86 points (almost 27 per 48 minutes) in his 155 minutes on the floor (before he went down with an injury himself). From Nov. 18 (when Russell missed his first game) through Dec. 9 (the game before he returned), the Lakers’ starters aggregate NetRtg was minus-22.8.
But it’s not as simple as the Lakers having 10 good players and problems setting in once new guys were introduced to the rotation. While they have a solid starting lineup and a good bench unit, they haven’t been great when those two lineups have been mixed and matched.
The Lakers have been outscored by 2.0 points per 100 possessions in the 1,025 total minutes in which they’ve had five of their top 10 guys on the floor. And in 394 minutes in which they’ve had 2-4 original starters on the floor with 1-3 guys from the strong bench unit, they’ve been outscored by 16.1 points per 100 possessions.

Within that 10-man rotation, there are some combinations that work and some that don’t. And that those mix-and-match lineups have played at a faster pace may be an issue.
With Tarik Black missing seven of the last eight games, Luke Walton has shortened the rotation to just the other nine guys. In that stretch, the Lakers’ three most-used lineups are a plus-11 in 131 minutes, but the team has been outscored by 98 points in the other 253.
No. 2
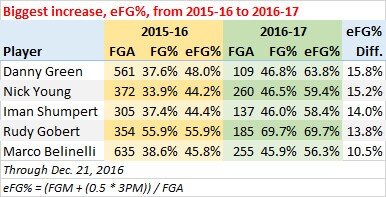
Nick Young has an effective field goal percentage of 59.4 percent, up from 44.2 percent last season.
The 59.4 percent is a career-high mark for Young by a wide margin, topping his previous high mark of 51.1 percent in 2013-14. And the jump of 15.2 percentage points is the second biggest among 207 players with at least 300 field goal attempts last season and at least 100 this season. Only the Spurs’ Danny Green has seen a bigger improvement.
Young already has 2 1/2 times as many points in the paint (52) as he had all of last season (20). But he is still very much a jump shooter, taking 83 percent of his shots from outside the paint.
According to SportVU, there were 151 players who took at least 300 jump shots last season. And Young was one of 10 for whom more than half of their jumpers were contested.
This season, Young has reduced the percentage of his jump shots that have been contested from 52 percent to 41 percent. Also, according to SportVU, 55 percent of his jumpers this season have been catch-and-shoot, up from only 46 percent last season.
Taking more uncontested, off-the-catch jumpers is a great way to improve your shooting. But Young has also shot better on catch-and-shoot jumpers, pull-up jumpers, uncontested jumpers, and contested jumpers than he did last season.

Randle ranks as the league’s 12th most improved shooter, having seen a jump in effective field goal percentage from 43.5 percent last season to 50.0 percent this season. That latter number is still below the league average, so Randle can get better, particularly on paint shots outside the restricted area, where he has shot just 28 percent.
As a team, the Lakers have seen the league’s biggest jump in effective field goal percentage, from 46.0 percent (30th) last season to 49.6 percent (18th) this season. But an increase in turnover rate has them (+4.6 points scored per 100 possessions) behind Toronto (+8.2) and Houston (+5.9) in regard to improvement in offensive efficiency.

No. 3
The Lakers have allowed 39.7 points in the restricted area per game, most in the league.
The Houston defense has allowed a higher field goal percentage in the restricted area, but only 30.3 percent of Houston’s opponents’ shots have come from there. The Lakers not only have the second highest opponent field goal percentage in the restricted area, their opponents have taken 34.5 percent of their shots from there, the fourth highest rate in the league.
Among 49 players who have defended at least five shots at the rim per game, Randle and Mozgov rank 41st and 42nd in rim protection, as opponents have shot 52.8 percent at the rim when either has been there. Black’s rim protection numbers (53.1 percent) aren’t any better, but opponents have taken a much lower percentage of their shots in the restricted area with Black on the floor (30.7 percent) than with Randle on the floor (35.0 percent).
That number is highest with Russell on the floor (37.2 percent) with Russell on the floor, and paint attacks can have more to do with perimeter defenders as it does interior defenders. According to SportVU, the Lakers allow the fourth fewest drives per game (25.1), but they rank last in points allowed per possession both drives (1.26) and ball screens (1.12).
While the Lakers have shown dramatic improvement on offense, they’ve barely budged on defense and are poised to rank in the bottom five on that end of the floor for the fourth straight season, with rim protection continuing to be their biggest problem.
John Schuhmann is a staff writer for NBA.com. You can e-mail him here, find his archive here and follow him on Twitter.
The views on this page do not necessarily reflect the views of the NBA, its clubs or Turner Broadcasting.


