

The Indiana Pacers were off to a pretty mediocre start to their season and then saw their best player get hurt.
A couple weeks later, the Pacers are 3-3 without Paul George, holding wins over the Oklahoma City Thunder and LA Clippers. Without their best defender, they’ve defended better than they did early in the season. After ranking 29th defensively (at 108.3 points allowed per 100 possessions) through their first 10 games, they’ve led the league in defensive efficiency (95.2) since. And three of their eight games in that stretch have been against top-10 offenses.
The Basics – Indiana Pacers
Pace: 100.3 (10th)
OffRtg: 100.7 (23rd)
DefRtg: 102.5 (13th)
NetRtg: -1.9 (18th)
Pacers links: Team stats | Player stats | Player shooting | Lineups
So maybe the Pacers are a great defensive team again. We’ll find out more in the next six days, as a five-game road trip begins with three straight games against teams that rank in the top eight in offensive efficiency. George is out again as the Pacers begin the trip with a visit to Portland on Wednesday on NBA TV (10 p.m. ET).

No. 1
Myles Turner has shot 51.4 percent from mid-range.
That’s the best mark among 62 players who have attempted at least 50 shots from between the paint and the 3-point line.
Turner is one of the league’s new “Stretch 5s,” centers who shoot from the perimeter. In just his second season and at 6-foot-11, he’s been one of the league’s best outside shooters. Good luck contesting his shot on a pick-and-pop.
Of course, Turner isn’t shooting 3s at the frequency of fellow centers DeMarcus Cousins, Marc Gasol or Brook Lopez. While he has the league’s sixth best field-goal percentage from outside the paint (among 184 players who have taken at least 50 shots from the outside), he has only the league’s 70th best *effective field goal percentage from outside the paint among that group, because his ratio of mid-range shots (72) to 3-point attempts (21) is 3.4.
* Effective field goal percentage = (FGM + (0.5 * 3PM)) / FGA
Lopez’s ratio is 0.2. With a field goal percentage of 46.2 percent vs. 36.8 percent, Turner’s shots from outside the paint have been more accurate. But with an effective field goal percentage of 51.9 percent vs. 49.5 percent, Lopez’s shots from outside the paint have yielded more points per attempt.
Only the San Antonio Spurs have taken a greater percentage of their shots from mid-range than Indiana has. The Pacers are the only team in the league with an above-average field goal percentage and a below-average effective field goal percentage. Lopez’s Nets are the only team that’s below average in the former and above average in the latter.
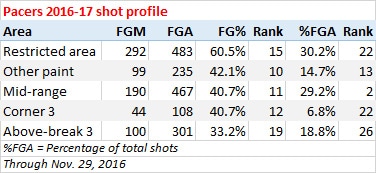
Turner may not ready to make the transition that Lopez has made this season. But, as a team, the Pacers can improve their effective field goal percentage by turning some of those mid-range attempts into layups or 3s.
No. 2
According to SportVU, the Pacers’ lead the league in ball-screen usage rate at 53.6 percent.

This means that, when the Pacers have set a screen for a ball-handler, it has resulted in a shot, turnover or drawn foul by the ball-handler or screener 53.6 percent of the time.
The Pacers have somewhat aggressive ball-handlers. But they’re only the 11th most likely team to get a shot from the guy with the ball on a pick-and-roll. They are the most likely team to pass to the screener, which they’ve done 31 percent of the time. (By comparison, the Phoenix Suns have passed to the screener less than half as often – 15 percent.)
Turner gets a lot of pick-and-pop opportunities, but Pacers ball-handlers have been more likely to pass the ball to Thaddeus Young (38 percent of the time) and Al Jefferson (36 percent) than Turner (27 percent). Of the three, Young is then the most likely to keep the ball moving.
In general, though, the Pacers don’t exactly turn into the Spurs of the 2014 Finals when they run a pick-and-roll. According to SportVU, they rank 22nd in passes per possession at 2.94.
There isn’t much of a correlation between usage rate on ball screens and efficiency on those possessions. Only two teams – Cleveland (7th and 3rd) and Oklahoma City (9th and 10th) rank in the top 10 in both. The Pacers don’t have LeBron James or Russell Westbrook and rank just 23rd with 1.00 points per possession on ball screens.
No. 3
Pacers reserves have an *aggregate NetRtg of minus-11.2 points per 100 possessions, a mark that ranks 29th in the league.
* Aggregate bench NetRtg takes the on-court point differential per 100 possessions for guys who come off the bench and weights it by minutes played.
There are a lot of teams that can say they have bench issues. But only the Sixers’ bench has been statistically worse than that of the Pacers.
The Pacers’ regular starting lineup – Jeff Teague, Monta Ellis, Paul George, Thaddeus Young and Turner – has outscored its opponents by only 0.3 points per 100 possessions in 228 minutes, a mark that ranks 27th among 36 lineups that have played at least 100 minutes together. Their lineup with Glenn Robinson III ranks second at plus-28.3 points per 100 possessions in 83 minutes.
All other Indiana lineups have been outscored by 7.2 points per 100 possessions in 577 minutes, with offense being more of an issue than defense. Early injuries to Aaron Brooks and Rodney Stuckey have hurt, but neither has been very good when they’ve been healthy and the Pacers have been outscored by an amazing 18.3 points per 100 possessions in Stuckey’s 149 minutes.
Stuckey has actually shot better than he did last season. But his assist rate is has dropped considerably and his turnover rate is the highest of his career by a wide margin. Al Jefferson is having the worst shooting season of his career, Lavoy Allen has shot 32 percent, and while Robinson is 9-for-17 from 3-point range as a starter, he was 2-for-15 as a reserve.
Indiana has been the league’s fifth best team in the first quarter (outscoring their opponents by 12.1 points per 100 possessions) and the ninth best team in the third (plus-5.6). But they’ve been the league’s worst second quarter team (minus-12.9) and second worst fourth quarter team (minus-16.3).
They’re an uneven team from top to bottom. Only the Clippers have a bigger discrepancy between their starters aggregate NetRtg and that of their bench.

John Schuhmann is a staff writer for NBA.com. You can e-mail him here, find his archive here and follow him on Twitter.
The views on this page do not necessarily reflect the views of the NBA, its clubs or Turner Broadcasting.


