With Boston up 2-1 against Golden State, what can we expect in Game 4 of the NBA Finals?
• Complete coverage: 2022 NBA Finals
The 2022 NBA Finals are through three games so far, and, to date, the Boston Celtics are halfway to an NBA title as they hold a 2-1 lead. But how have the teams stacked up in terms of stats? We take a closer look below.
Traditional stats

There have been 144 minutes played through the first three games of The Finals, with Boston having led for 69 of those minutes (47.9%) and Golden State having led for 66 minutes (45.8%). Additionally, there have been nine minutes with the game tied (6.3%). There have been a total of 20 lead changes and 12 ties so far, but most of those came from the first two games in San Francisco. In their first Finals game at home in 12 years, the Celtics led for 47 of 48 minutes in a game that featured just three lead changes.
Much of Boston’s +17 rebound advantage in The Finals came in Game 3 as the Celtics won the boards 47-31 overall and 15-6 on the offensive glass. While Golden State’s Kevon Looney is the series’ top overall rebounder (23) and offensive rebounder (10), the Celtics have gotten the job done as a collective as they have seven of the top rebounders in the series, led by Jaylen Brown and Al Horford with 22 boards apiece.
Should Steve Kerr make drastic changes in the Warriors' lineup for Game 4 on Friday?
Brown has secured the rebound on 73% of his rebound chances *, the second-highest rate of any player with seven or more total rebounds behind only teammate Payton Pritchard (83%).
(* = A player has a rebound chance if they are the closest player to the ball at any point in time between when the ball has crossed below the rim to when it is fully rebounded.)
When looking at these traditional stats, the one significant advantage for the Warriors comes in steals (+11). Similar to Boston’s edge in rebounding, much of this advantage was built during Golden State’s Game 2 win when they racked up 15 steals — the most in a Finals game since Game 2 of the 2017 Finals when Cleveland had 15 steals in a loss to Golden State. Our own John Schuhmann dug into those steals (live-ball turnovers for the Celtics) in his Game 2 Finals Stat breakdown for that game.
Shooting stats

What separates the Celtics and Warriors through three games are two field goals (116-114) and five free throws (43-38), all in favor of Boston. The teams are even in 3-pointers made with 49 apiece, although Boston is making 3-pointers at a higher percentage. Looking back at Golden State’s six Finals runs since 2015, the Warriors have allowed over 40% shooting from 3-point range in just one series before these Finals — when Portland shot 42.8% from 3-point range in the 2016 Western Conference semifinals.
Boston has made five more (and also attempted seven more) free throws than Golden State thus far. The key stat to look at here is drives to the basket, where Boston has a 155-114 advantage in total drives and a 15-10 advantage in free throws made on drives. The Celtics have drawn twice as many fouls as the Warriors when they drive to the hoop.
Miscellaneous stats
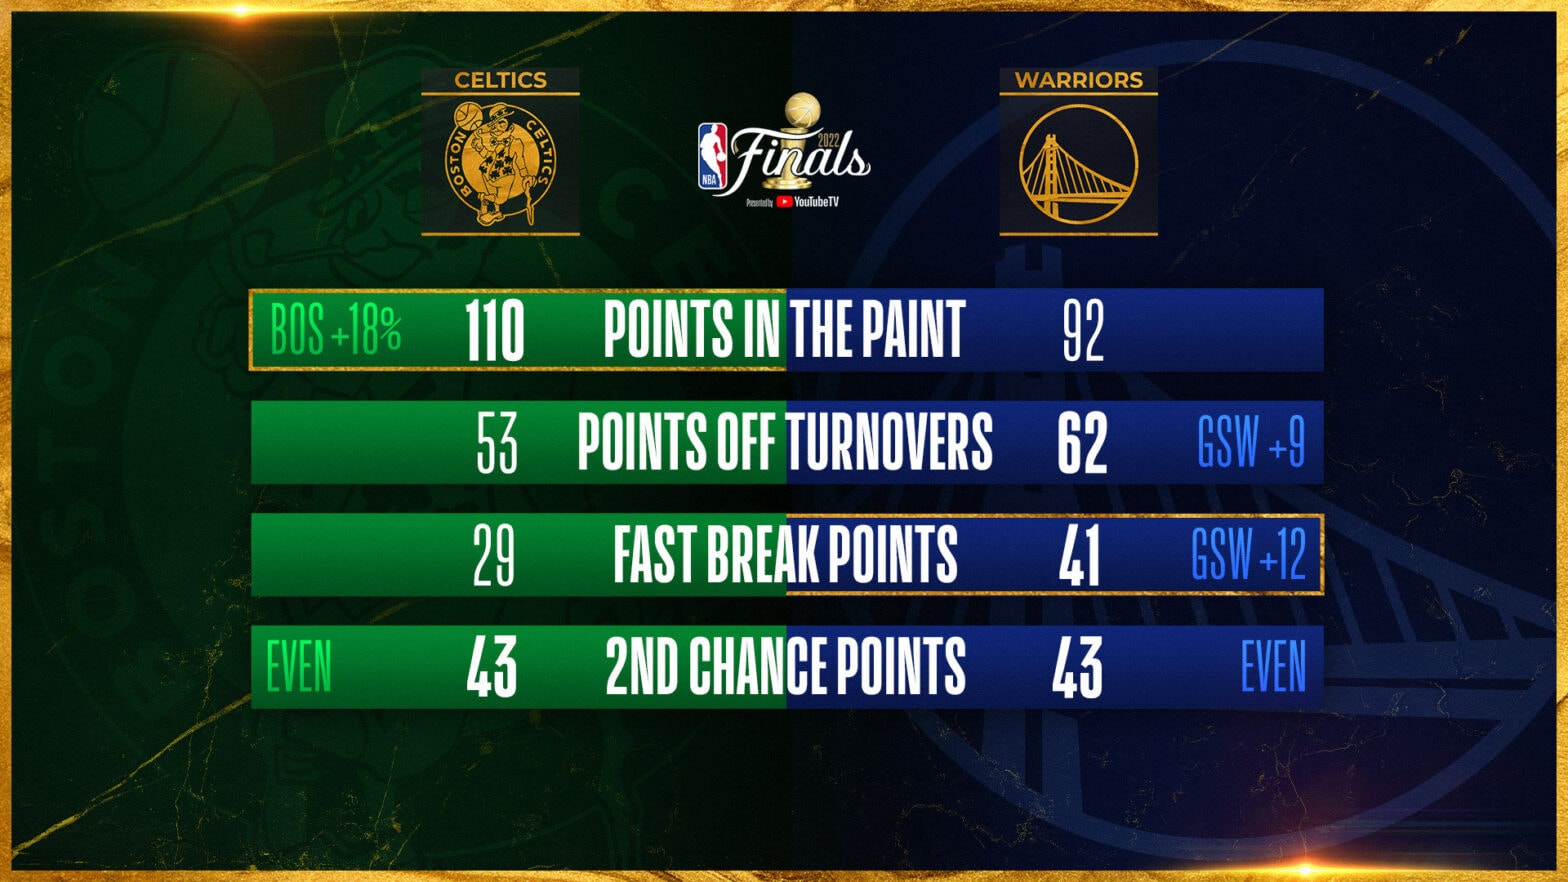
One stat that has been connected to the winner of all three games is points in the paint — the team that wins that battle has won each game. Boston had a 34-26 advantage in Game 1, Golden State lead it 40-24 in Game 2 and Boston had it, 52-26, in Game 3 (as Schuhmann details here).
Facing the league’s top-ranked defense — 106.2 defensive rating in the regular season, 105.1 in the postseason entering The Finals — the Warriors have to take advantage of transition opportunities to score easy baskets before the Celtics’ stifling defense can set up. However, holding the edge on the break does not guarantee a win: Golden State outscored Boston 18-4 in fast-break points in Game 3 … and still lost by 16.
The Celtics (15.4%) and Warriors (15.1%) have turned the ball over at similar rates during the playoffs and during the Finals, specifically. In Game 1, Boston outscored the Warriors by 11 points off turnovers (21-10) and finished with a 12-point win. In Game 2, it was Golden State’s turn to capitalize on Boston’s mistakes, racking up an 18-point advantage (33-15) in points off turnovers in a 19-point win. The one game that didn’t hold to form was Game 3, as Golden State won the points-off-turnover battle, 19-17, but lost 116-100.
Advanced stats

While the Celtics are unlikely to match the 119.2 offensive rating they posted in their first-round sweep of the Brooklyn Nets, their 113.3 offensive rating through three games is better than what they posted in each of the past two rounds against the Milwaukee Bucks (108.8) and Miami Heat (110.7). Meanwhile, Golden State’s 110.5 offensive rating is well behind how it performed against the Dallas Mavericks (120.3) and Denver Nuggets (121.9), but is slightly better than how it fared against the Memphis Grizzlies (108.3).
The similarities in effective field goal percentage and true shooting percentage illustrates how close this series is. However, one stat that is surprisingly not close is assist percentage. The Celtics are utilizing the pass to set up scoring opportunities at a much higher rate than the Warriors.
During the regular season, the Warriors led the NBA in assist percentage as more than two-thirds of their baskets (66.9% to be exact) came off an assist. On the other hand, Boston ranked 14th at 60.9%. In the postseason (before these Finals), the Warriors were the top team in assist percentage (66.9%,), while the Celtics climbed to second (65.5%). But since the Finals started, Golden State’s assists are down to 62.3% and Boston’s are in another stratosphere at 73.3%.
Part of that drop off has to be credited to Boston’s defense, which has disrupted Golden State’s normally free-flowing, pass-heavy offense. But if we look at the numbers, the Warriors’ passing frequency has steadily dropped from the regular season (310.3 passes per game, second in NBA), to the playoffs prior to the Finals (281.6 passes per game, fifth of 16 teams), and now down to 267 passes per game through three games of the Finals — 23 fewer passes per game than the Celtics.


