Stephen Curry and the Warriors lead the NBA with a 10-1 record.
• Get NBA League Pass NOW: Stream FREE for 7 days
Each week during the season, NBA.com writer John Schuhmann surveys the league to compile stats and notes for his in-depth Power Rankings. Before the next rankings drop on Monday, here are some of the storylines he’s keeping an eye on this weekend.
1. How real are those records?
The 20-game mark is the time to really evaluate how good teams are in the new season. As noted in an analysis of the 2021-22 schedule, over the last 20 full (82-game) seasons, 86% of teams that won at least 11 of their first 20 games made the playoffs. Meanwhile, only 13% of the teams that won fewer than nine of their first 20 games reached the postseason.
We’re more than halfway to that 20-game mark (teams have averaged 11.3 games through Wednesday), but we can still say “it’s early” with some teams. The question is which teams those are.
To determine which early-season records might be deceiving, we can look a few factors:
• Strength of schedule. At this point, there can be a big variance in how tough schedules have been, especially when you take home/road and rest into account.
• Point differential. The Dallas Mavericks are 7-4, while the LA Clippers are 6-4. But the Mavs have been outscored by 33 points, while the Clippers are +48 on the season. The point differential might mean a brighter future for LA.
• Opponent shooting. A defense can only control opponent 3-point shooting somewhat. And it can’t control opponent free throw percentage at all. Some teams have had better luck than others in regard to those two numbers.
Taking those factors into account, here are the four teams who’s records look to be inflated the most:
1. Golden State (10-1): The Warriors have looked fantastic and they’re eventually going to get Klay Thompson back. But they’re probably not going to win 73 games again. They’ve played the league’s easiest schedule, with eight of their 11 games having come against teams with losing records and eight of the 11 having come at home. Their opponents have also shot relatively poorly from 3-point range and from the free throw line.
The Warriors’ eight-game homestand ends on Friday with maybe their toughest test of the season thus far. The Bulls are in town for the second game of ESPN’s doubleheader (10 p.m. ET).
2. Brooklyn (8-4): The Nets have also played a relatively easy schedule, with only four of their 12 games having come against teams with winning records. They’ve also seen the league’s third biggest drop in opponent 3-point percentage. One could argue that their offense (currently ranked 21st) will obviously get better if/when James Harden really starts to find his rhythm. One could also argue that LaMarcus Aldridge can’t shoot 72% from mid-range all season. Seventy-two percent!
3. L.A. Lakers (7-5): The Lakers should get healthier as the season goes on, and they got a good win against the Heat on Wednesday. But that win came with Miami shooting 1-for-6 from the free throw line (though one of the misses was intentional) in overtime. L.A. ranks second in opponent free throw percentage (71.3%), has played an easy and home-heavy schedule, and has a negative point differential (-6) with its winning record.
4. Dallas (7-4):– As noted, the Mavs have the point differential of a team that’s 4-7. Their seven wins have come by an average of 7.0 points, while their four losses have come by an average of 20.5.
And here are four teams who could be better than their record indicates:

Trae Young and the Hawks have struggled out of the gate in 2021-22.
1. Indiana (4-8): The Pacers have played a road-heavy and relatively tough schedule. They’re also 2-6 in games that were within five points in the last five minutes after a three-point loss in Denver on Wednesday dropped them to 4-8 with the point differential of a team that’s 6-6.
2. New Orleans (1-11): It’s hard to make a case for the Pelicans when, in the last week, they’ve lost a game (to Golden State) by 41 points and lost at home to Oklahoma City. But they’ve had some bad luck late in games, 0-6 in those that were within five points in the last five minutes. Their opponents have also shot unusually well (81.3%) from the line.
3. Atlanta (4-8): After the Hawks visit the Nuggets on Friday (9 p.m. ET, League Pass), 11 of their 13 games will have come against teams that currently have winning records, while nine of the 13 will have come on the road. The three back-to-backs they’ve already played are tied for the league high and their opponents have shot a league-high 84.3% from the line.
4. Miami (7-4): The Heat’s schedule has been relatively tough and road-heavy. And their point differential says they should be 8-3.
2. Defensive changes
Last week, we looked at the teams that made the biggest changes in pace, ball movement and 3-point rate. Though pace is a mix of how fast a team and its opponents have played, those changes are mostly about offense.
There are also some teams that have made major changes on defense in that they’re defending pick-and-rolls much differently. Here are six teams who have seen big changes to their pick-and-roll-defense profile, according to Second Spectrum tracking:
1. Minnesota
The Wolves have employed a “blitz” or “show” coverage on 20% of opponent ball screens, according to Second Spectrum. That’s the league’s second-highest rate and up from just 4% (second lowest rate) last season. The more aggressive scheme has helped the Wolves lead the league in opponent turnover rate (18.3 per 100 possessions). The extra pressure on the ball-handler can make it more difficult to make a play …

The Wolves have seen the league’s ninth biggest drop in points allowed per 100 possessions, climbing from 28th last season to 17th this season, so the change has seemingly worked thus far. But five of their 10 games have come against teams that rank in the bottom 10 offensively. Their loss to Golden State on Wednesday was just their first game against a team that currently ranks in the top 10.
2. Portland
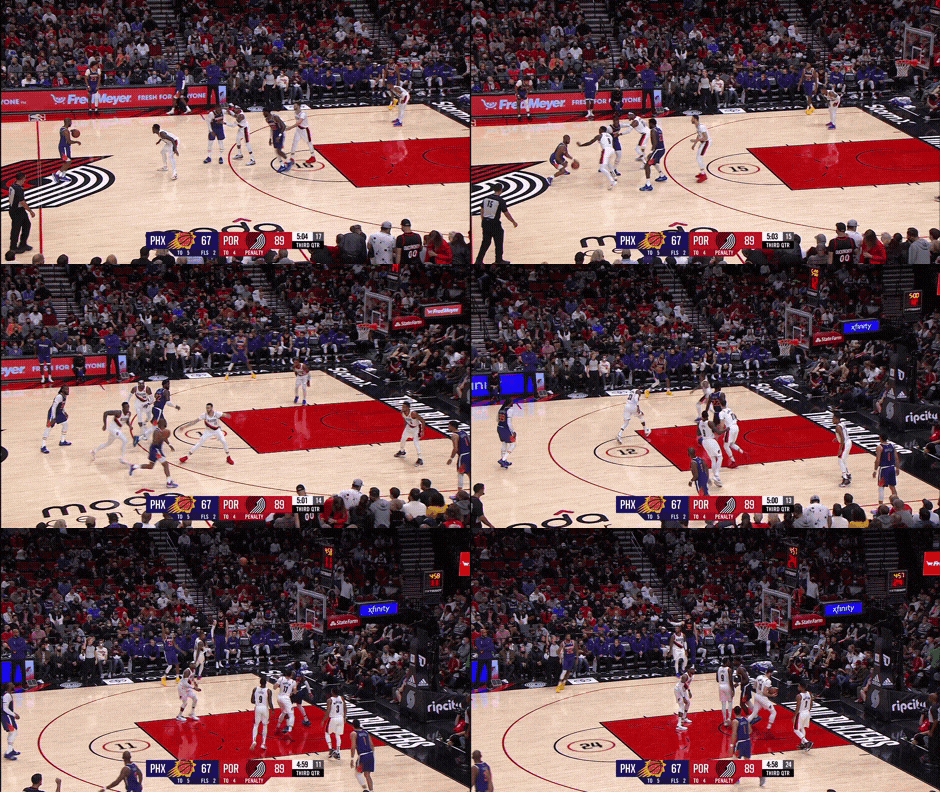
Like Minnesota, Portland has switched to a more aggressive scheme. It hasn’t worked out so well for the Blazers, but they’ve faced a tougher schedule than the Wolves.
As was seen in New Orleans last season, a more aggressive scheme can leave you susceptible to weak-side 3-pointers. To cover for the big man who’s out away from the basket, a weak-side defender has to sink deep in the paint. And if the ball-handler can get off the ball quickly, it will find an open shooter before the weak side defender can recover …

The Blazers are one of three teams — the Hawks and Knicks are the others — that rank in the bottom 10 in both opponent 3-point percentage (38.3%, 28th) and the percentage of their opponents’ shots that have come from 3-point range (42%, 22nd). Only the Heat have allowed more corner 3s per game, and the Wolves (not coincidentally) aren’t far behind.
The good news is that the Blazers don’t rank 29th defensively like they did last season. They’re 22nd, having played five of their 12 games against teams that currently rank in the top 10 on offense. Their first two games against teams that currently rank in the bottom 10 will be Friday (in Houston) and Sunday (in Denver).
3. Charlotte
Like they did last season, the Hornets have played the most zone in the league. But they’ve seen a drop (from 14% to 7%) in the percentage of their opponents’ possessions on which they’ve played zone, according to Synergy tracking. In their man-to-man, they’ve played more “drop” coverage, according to Second Spectrum.
Whatever they’re doing, it’s not working. The Hornets rank 28th defensively, one of five teams that have allowed more points per 100 possessions than they did last season (with the league average having dropped 4.8 per 100).
4. Boston/Brooklyn
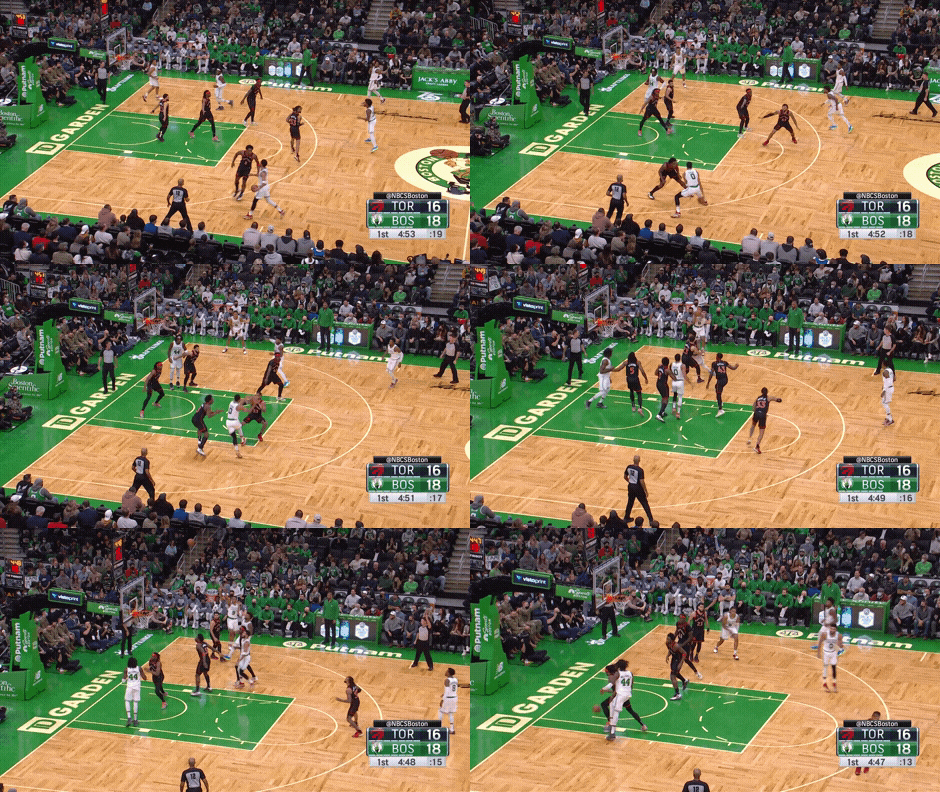
Under new coach Ime Udoka, the Celtics have gone all-in on switching. Last season, they switched 29% of ball screens, the league’s fifth-highest rate, according to Second Spectrum. This season: 48%, the highest rate by a huge margin. After holding Toronto to just 88 points on 98 possessions on Wednesday, the Celtics have climbed into the top 10 on defense.
Udoka’s previous team (Brooklyn), meanwhile, has seen the biggest drop in the percentage of ball screens that they’ve switched. And that’s worked for the Nets, who’ve seen the league’s third biggest drop in points allowed per 100 possessions (10.0 fewer than they allowed last season) and rank fifth defensively. They’ve played a relatively easy schedule (as noted above), but the Nets have played more games against top-10 offenses (4) than bottom-10 offenses (3). Of course, two of those latter three were against the 30th-ranked Pistons.
5. Milwaukee
This is probably more about personnel. With Brook Lopez having played in only one of their 12 games, the Bucks have employed less drop coverage and switched a lot more screens than they did last season. Stay tuned.
3. The empty corner
No matter what your scheme, one of the toughest plays to defend in the NBA is the empty-corner pick-and-roll. It’s a pick-and-roll from the side of the floor (instead of from the top) with the other three offensive players on the opposite side …

… instead of having a shooter stationed in the corner on the side of the floor from which the pick-and-roll is originating …

What can make it difficult is the absence of help behind the roll man. So if the ball-handler can get into the paint and engage the screener’s defender, the screener can get a clean roll to the basket …

There are ways for the defense to keep the ball-handler from getting to the middle of the paint. First, the defender on the ball can “ice” the screen, keeping the ball-handler on the side of the floor. But if ball-handler rejects the screen, he can attack the screener’s defender. Or, if the screener is a shooter, he can get an open 3 when his defender stops the drive …

If the ball-handler uses the screen, the weak-side high defender can pinch to the “nail” (middle of the free throw line) to stop the drive and allow the screener’s defender to retreat to the roll. But the nail defender is leaving his man (who’s one pass away and in the vision of the ball-handler) open for a 3 or able to attack the seam …

The simplest solution may be to switch the screen, but that can leave you with a mismatch …

That DeMar DeRozan iso was one of several empty-corner pick-and-rolls that the Chicago Bulls ran opening night in Detroit. They have two primary scorers to handle the ball and, while Nikola Vucevic isn’t a rim-running lob threat (he’s just 20-for-43 in the restricted area), the empty-corner gives him plenty of space to find an open jumper.

When they were in Chicago a couple of weeks ago, the Knicks had Julius Randle rotate from the weak side to defend Vucevic’s roll. Kemba Walker then rotated down to deflect Vucevic’s pass to Randle’s man …

Later in the game, Randle was late with his rotation and committed a foul …

With a comfortable win over Dallas on Wednesday, the Bulls are 8-3, one of four teams that rank in the top 10 on both ends of the floor. They visit one of the others (the 10-1 Warriors) as they begin a five-game trip through the Western Conference on Friday (10 p.m. ET on ESPN).
4. Feast or famine
The Toronto Raptors may be the most fun team to watch on defense. They’re aggressive (loading up to to the strong side of the floor), they’re handsy, and they’re daring. They lead the league in deflections per game (21.3) by a healthy margin, with Gary Trent Jr. (4.5), Fred VanVleet (4.2) and OG Anunoby (3.3) ranking first, fourth and 12th among individuals. With that, the Raptors rank second in opponent turnover rate (17.9 per 100 possessions).
But in the other three of the “four factors” on defense, the Raps rank 20th (opponent effective field goal percentage), 21st (opponent free throw rate) and 22nd (opponent offensive rebounding percentage), because theirs is a feast-or-famine defense. While their aggressiveness can turn the other team over and spark their fast break, it can also lead to fouls, and it can leave them vulnerable to weak-side 3-pointers …

And offensive boards …

A little less than 33% of Toronto opponent 3-point attempts, the league’s highest rate by a healthy margin, have come from the corners. Of course, when they rotate well, the Raptors’ defense can be a thing of beauty …

(That’s an X out in more ways than one.)
The Raptors are in Philadelphia on Thursday, where their feast-or-famine (and 11th-ranked) defense will face what has been the league’s most efficient offense (7 p.m. ET, NBA TV), though the Sixers will be without Joel Embiid for a third straight game. Both Seth Curry (foot) and Tobias Harris (health and safety protocols) are listed as questionable as of Thursday morning.
5. Trending up
As has been noted everywhere and every day, offense is down this season. Through Wednesday (170 games played), the league has averaged 106.9 points scored per 100 possessions. That’s a big drop from last year’s number (111.7), which was the highest in NBA history. Now, efficiency typically goes up as the season goes along, but 106.9 is also down from this point last season. Through Jan. 14 of this year (171 games played), the league had averaged 109.8 points per 100 possessions.
Things are trending up, though. In 77 November games, the league has scored 108.4 per 100, up from 105.6 in October (93 games). The league-wide free throw rate has only risen a tick – the November rate of 22.5 attempts per 100 shots from the field would still be the lowest in NBA history – but shooting has improved, turnovers are down, and offensive rebounding is up.
League-wide efficiency and four factors
| Month/season | OffRtg | eFG% | FTA Rate | TO% | OREB% |
|---|---|---|---|---|---|
| October | 105.6 | 51.3% | 0.222 | 14.9% | 26.4% |
| November | 108.4 | 52.3% | 0.225 | 14.5% | 27.3% |
| 2021-22 Total | 106.9 | 51.7% | 0.223 | 14.7% | 26.8% |
| 2020-21 through Jan. 14 | 109.8 | 53.3% | 0.249 | 14.5% | 26.3% |
OffRtg = Points scored per 100 possessions
eFG% = (FGM + (0.5 * FTM)) / FGA
FTA Rate = FTA / FGA
TO% = Turnovers per 100 possessions
OREB% = Percentage of available rebound obtained
* * *
John Schuhmann is a senior stats analyst for NBA.com. You can e-mail him here, find his archive here and follow him on Twitter.
The views on this page do not necessarily reflect the views of the NBA, its clubs or Turner Broadcasting.


