
It wasn’t that long ago that the Atlantic Division was the worst in the NBA. But this year, the Atlantic was one of two divisions with four playoff teams. And now, it’s the only division with three teams in the conference semifinals.
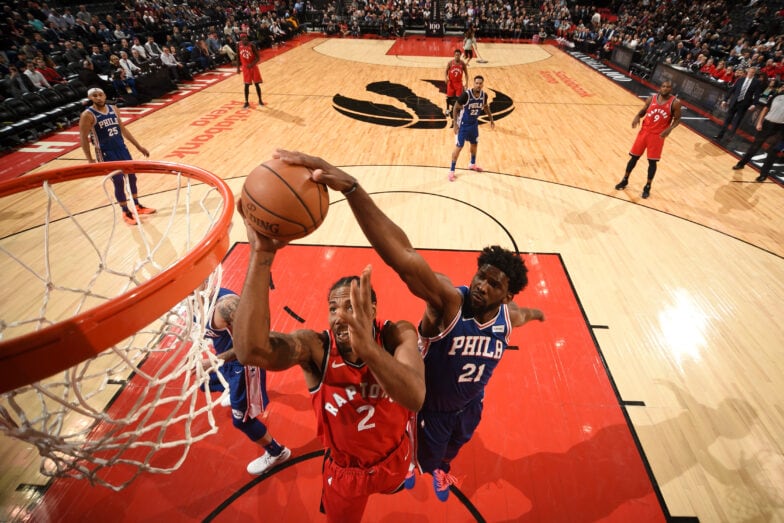
This series pits the two teams that finished atop the division against each other. The Toronto Raptors are in the playoffs for the sixth straight season and this may be the best team in franchise history. The same can’t be said about a historic franchise like the Philadelphia 76ers, but the Sixers have come a long way from when they went 10-72 just three seasons ago.
Both teams took care of business in the first round after dropping Game 1 at home. And both teams have starting lineups that have been absolutely dominant.
The only other time these two franchises met in the playoffs was in the conference semifinals in 2001, when Vince Carter missed the potential game-winning shot in Game 7 and the Sixers went on to reach The Finals.
Here are some statistical notes to get you ready for the Eastern Conference semifinals, with links to let you dive in and explore more. Game 1 is Saturday (7:30 ET, TNT).
Pace = Possessions per 48 minutes
OffRtg = Points scored per 100 possessions
DefRtg = Points allowed per 100 possessions
NetRtg = Point differential per 100 possessions
Toronto Raptors (58-24, 4-1)
First round: Beat Orlando in five games.
Pace: 95.7 (13)
OffRtg: 111.5 (6)
DefRtg: 95.8 (2)
NetRtg: +15.7 (2)
Regular season: Team stats | Advanced splits | Player stats | Player shooting | Lineups
vs. Philadelphia: Team stats | Advanced splits | Player stats | Player shooting | Lineups
Playoffs: Team stats | Advanced splits | Player stats | Player shooting | Lineups
Raptors postseason notes – General:
- Only Eastern Conference team that has won a playoff series in each of the last four years. Have won four straight playoff games for the first time in franchise history.
- Have seen the biggest drop in pace from the regular season (100.6 possessions per 48 minutes, 15th in the league) to the playoffs (95.7, 13th).
- Have been at their best in the first (plus-27.8 points per 100 possessions) and third (plus-32.0) quarters. Were a plus-9.6 per 100 possessions in the second quarter and were outscored by 6.5 per 100 in the fourth.
| Area | FGM | FGA | FG% | Rank | %FGA | Rank |
|---|---|---|---|---|---|---|
| Restricted area | 92 | 149 | 61.7% | 7 | 35% | 5 |
| Other paint | 26 | 55 | 47.3% | 3 | 13% | 12 |
| Mid-range | 24 | 55 | 43.6% | 5 | 13% | 12 |
| Corner 3 | 17 | 52 | 32.7% | 14 | 12% | 3 |
| Above-break 3 | 43 | 111 | 38.7% | 4 | 26% | 12 |
| %FGA = Percentage of total shots | ||||||
Raptors postseason notes – Offense:
- Lead the playoffs with 5.2 secondary assists per game. Rank second in the playoffs in ball movement (358 passes per 24 minutes of possessions), but 12th in player movement (10.8 miles traveled per 24 minutes of possession), according to Second Spectrum tracking.
- Lead the postseason with 9.8 catch-and-shoot 3-pointers per game.
- Ranked third in the first round with 31.4 points per game on drives.
Raptors postseason notes – Defense:
- Were the league’s second most improved defensive team in the first round, allowing 11.0 fewer points per 100 possessions than they did in the regular season. The 95.8 points per 100 that the Magic scored were also 12.3 fewer than they scored in the regular season. That was the second biggest drop in offensive efficiency.
- Have allowed just 0.96 points per possession in transition, the lowest mark in the playoffs.
- Lead the playoffs with deflections (14.6) and charges drawn (1.8) per game.
| Season | OffRtg | Rank | eFG% | Rank | OREB% | Rank | TO% | Rank | FTA Rate | Rank |
|---|---|---|---|---|---|---|---|---|---|---|
| Reg. season | 112.5 | 5 | 54.3% | 3 | 26.5% | 19 | 13.8% | 14 | 0.247 | 21 |
| Playoffs | 111.5 | 6 | 55.0% | 3 | 20.4% | 15 | 12.8% | 5 | 0.190 | 15 |
| OffRtg = Points scored per 100 possessions
eFG% = (FGM + (0.5 * 3PM)) / FGA OREB% = Percentage of available offensive rebounds obtained. TO% = Turnovers per 100 possessions. FTA Rate = FTA/FGA |
||||||||||
| Season | DefRtg | Rank | eFG% | Rank | DREB% | Rank | TO% | Rank | FTA Rate | Rank |
|---|---|---|---|---|---|---|---|---|---|---|
| Reg. season | 106.8 | 5 | 50.9% | 4 | 72.5% | 18 | 14.7% | 9 | 0.249 | 12 |
| Playoffs | 95.8 | 2 | 45.1% | 2 | 74.0% | 7 | 16.3% | 2 | 0.267 | 6 |
| DefRtg = Points allowed per 100 possessions
DREB% = Percentage of available defensive rebounds obtained. |
||||||||||
Raptors postseason notes – Lineups:
- Starting lineup outscored the Magic by 46.3 points per 100 possessions, the second best mark among lineups that have played at least 35 minutes in the playoffs.
- Kyle Lowry leads the postseason in raw plus-minus, with the Raptors having outscored the Magic by 106 points with him on the floor. They’ve been 53.9 points per 100 possessions better with Lowry on the floor (plus-30.1) than they’ve been with him off the floor (minus-23.8). That’s the biggest on-off-court NetRtg differential among players that have played at least 100 minutes in the postseason. Leonard (42.1) has the third biggest differential.
- Have been outscored by 13 points in 25 minutes with Siakam on the floor without either Lowry or Leonard.
Raptors postseason notes – Individuals:
- Marc Gasol has an assist-turnover ratio of 7.00 (14/2), the fourth best mark among players that have averaged at least 15 minutes per game in three or more playoff games.
- Gasol has traveled at an averaged speed of 3.50 miles per hour, slowest among players that have averaged at least 15 minutes in three games or more.
- Danny Green has shot just 3-for-13 on corner 3-pointers, the worst mark among players who have attempted at least 10.
- Kawhi Leonard has an effective field goal percentage of 63.3 percent, the fourth best mark among players with at least 50 field goal attempts. He has shot 14-for-26 (54 percent) from 3-point range, the best mark among players with at least 25 postseason attempts.
- Leonard is one of two players (Paul George is the other) that have averaged at least five points per game on drives, five points per game on catch-and-shoot jumpers, and five points per game on pull-up jumpers in the playoffs.
- Kyle Lowry has recorded assists on 38.7 percent of his possessions, the second highest rate among players that have averaged at least 15 minutes per game in three or more playoff games.
- Lowry leads the playoffs with 1.4 charges drawn per game.
- Pascal Siakam has played 37.6 minutes per game, second most among players that have advanced to the conference semifinals. He has traveled 2.87 miles per game, most in the postseason.
- Siakam has averaged 15.2 points in the paint per game, third most in the postseason. He has shot 18-for-28 (64 percent) on drives, the second best mark among players with at least 20 field goal attempts on drives.
- Siakam has a free throw rate of just 11 attempts per 100 shots from the field, down from 32 in the regular season. That’s the biggest drop among players with at least 500 field goal attempts in the regular season and at least 50 in the playoffs.
Philadelphia 76ers (51-31, 4-1)
First round: Beat Brooklyn in five games.
Pace: 105.6 (1)
OffRtg: 115.7 (3)
DefRtg: 105.7 (7)
NetRtg: +10.0 (3)
Regular season: Team stats – Advanced splits – Player stats – Player shooting – Lineups
vs. Toronto: Team stats – Advanced splits – Player stats – Player shooting – Lineups
Playoffs: Team stats – Advanced splits – Player stats – Player shooting – Lineups
Sixers postseason notes – General:
- Their series with the Nets was the second fastest paced series (105.6 possessions per team per 48 minutes) in the 23 years for which we have play-by-play data.
- Only team this year that has won a first round series while being outscored from 3-point range. Over five games, the Sixers made 10 fewer 3-pointers than Brooklyn.
| Area | FGM | FGA | FG% | Rank | %FGA | Rank |
|---|---|---|---|---|---|---|
| Restricted area | 99 | 155 | 63.9% | 4 | 33% | 7 |
| Other paint | 47 | 94 | 50.0% | 1 | 20% | 4 |
| Mid-range | 39 | 83 | 47.0% | 1 | 18% | 5 |
| Corner 3 | 15 | 39 | 38.5% | 7 | 8% | 8 |
| Above-break 3 | 30 | 94 | 31.9% | 13 | 20% | 15 |
| %FGA = Percentage of total shots | ||||||
Sixers postseason notes – Offense:
- Were the league’s third most improved offensive team in the first round, scoring 4.2 more points per 100 possessions than they did in the regular season. Had the most efficient game of the postseason thus far when they scored 145 points on 105 possessions in Game 2.
- Rank second in the playoffs in ball movement (358 passes per 24 minutes of possessions) and 12th in player movement (10.8 miles traveled per 24 minutes of possession). They ranked first in both in last year’s postseason.
- Led the postseason with 58.4 points in the paint per game and 19.0 second chance points per game.
- Have taken 28.8 percent of their shots from 3-point range, the second lowest rate in the playoffs and down from 34.2 percent (18th) in the regular season. That is the second biggest drop among playoff teams.
Sixers postseason notes – Defense:
- Brooklyn averaged 60.8 drives and 33.2 points scored off drives per game. Both were the highest marks in the first round.
- The Nets took 54 percent of their shots, the postseason’s highest rate, in the paint. But they shot just 48 percent, the postseason’s second worst mark, on those paint shots.
- Though they were outscored from 3-point range overall, the Sixers allowed Brooklyn to make just five corner threes, fewest in the first round.
| Season | OffRtg | Rank | eFG% | Rank | OREB% | Rank | TO% | Rank | FTA Rate | Rank |
|---|---|---|---|---|---|---|---|---|---|---|
| Reg. season | 111.5 | 8 | 53.3% | 8 | 27.8% | 11 | 14.4% | 24 | 0.312 | 2 |
| Playoffs | 115.7 | 3 | 54.2% | 5 | 35.7% | 1 | 15.5% | 14 | 0.298 | 4 |
| OffRtg = Points scored per 100 possessions
eFG% = (FGM + (0.5 * 3PM)) / FGA OREB% = Percentage of available offensive rebounds obtained. TO% = Turnovers per 100 possessions. FTA Rate = FTA/FGA |
||||||||||
| Season | DefRtg | Rank | eFG% | Rank | DREB% | Rank | TO% | Rank | FTA Rate | Rank |
|---|---|---|---|---|---|---|---|---|---|---|
| Reg. season | 108.9 | 14 | 51.2% | 6 | 74.1% | 7 | 12.3% | 28 | 0.268 | 22 |
| Playoffs | 105.7 | 7 | 48.0% | 5 | 74.2% | 6 | 13.5% | 11 | 0.319 | 14 |
| DefRtg = Points allowed per 100 possessions
DREB% = Percentage of available defensive rebounds obtained. |
||||||||||
Sixers postseason notes – Lineups:
- Starting lineup outscored the Nets by 62.2 points per 100 possessions, the best mark among lineups that have played at least 35 minutes in the playoffs.
- Have been 45.8 points per 100 possessions better with Tobias Harris on the floor (plus-25.5) than they’ve been with him off the floor (minus-20.3). That’s the second biggest on-off-court NetRtg differential among players that have played at least 100 minutes in the postseason.
- The Sixers have allowed just 85.6 points per 100 possessions with Embiid on the floor. That is the third lowest on-court DefRtg mark among players that have averaged at least 15 minutes in three postseason games or more.
Sixers postseason notes – Individuals:
- Jimmy Butler leads the postseason with 5.6 points per game scored on non-restricted-area shots in the paint. He has shot 14-for-21 (67 percent) on those shots, the second best mark among players who have attempted at least 10.
- Joel Embiid leads the postseason in rebounding at 13.5 rebounds per game. Embiid (23.7 percent) and Boban Marjanovic (19.6 percent) rank second and third, respectively, in rebounding percentage among players that have averaged at least 15 minutes in three postseason games or more.
- Embiid also ranks second in postseason usage rate (having used 37.0 percent of the Sixers’ possessions while he’s been on the floor) and blocks per game (2.8).
- Tobias Harris has shot 9-for-16 (56 percent) on catch-and-shoot 3-pointers, the third best mark among players with at least 15 attempts.
- J.J. Redick has scored 0.504 points per touch, most among players with at least 100 postseason touches.
- Redick has traveled at an averaged speed of 4.53 miles per hour, fastest among players that have advanced to the conference semifinals.
- Ben Simmons has an effective field goal percentage of 64.3 percent, the second best mark among players with at least 50 field goal attempts.
- Simmons ranks second with 3.4 deflections per game.
- Embiid (11.0) and Simmons (10.4) rank third and fifth in points per game scored in the restricted area.
Regular season matchup
Raptors won, 3-1 (2-0 in Toronto)
Oct. 30 @ Toronto – Raptors 129, Sixers 112
Dec. 5 @ Toronto – Raptors 113, Sixers 102
Dec. 22 @ Philadelphia – Sixers 126, Raptors 101
Feb. 5 @ Philadelphia – Raptors 119, Sixers 107
Pace: 105.1 possessions (per team) per 48 minutes
Toronto OffRtg: 109.7 (12th vs. Philadelphia)
Philadelphia OffRtg: 106.4 (19th vs. Toronto)
Individual matchups: TOR offense vs. PHI defense | PHI offense vs. TOR defense
Matchup notes:
- The Sixers have lost 13 straight games in Toronto.
- All four games took place before the Raptors traded for Marc Gasol and the Sixers traded for Tobias Harris. The first meeting took place before Philadelphia traded for Jimmy Butler.
- The Raptors were 3-0 against the Sixers with Kawhi Leonard, who is 13-0 in his career against Philadelphia and missed the Dec. 22 game. Serge Ibaka also missed that game and Fred VanVleet missed the first meeting for Toronto. J.J. Redick missed the fourth meeting for the Sixers.
- Toronto scored 116.1 points per 100 possessions over their three wins and just 91.8 in their one loss.
- In the Dec. 22 meeting, the teams combined for 61 fast break points. The Sixers’ 33 were the most they registered all season. The Raptors had 27 or 28 in each of the first three meetings, three of the seven highest fast-break-point totals against the Sixers.
- Over the four games, the Sixers had 20 more turnovers than the Raptors (75-55). Philly had a turnover rate of 20 per 100 possessions in their three losses and just 11.8 per 100 in their one win. Ben Simmons’ 25 turnovers were 10 more than he had against any other opponent this season.
- Leonard was the primary defender on Simmons and in the three games he played, Leonard had 12 steals, four more than any other player had vs. Philadelphia in the regular season.
- Gasol did play two games against the Sixers with the Memphis Grizzlies, who had success defensively on the possessions in which Gasol defended Embiid. The 8-for-28 (29 percent) that Embiid shot against Memphis was the worst he shot against any opponent that he faced more than once this season.
- Harris played two games vs. Toronto when he was with the Clippers. The 9-for-28 (32 percent) he shot over the two games was his second worst mark vs. any opponent this season. His primary defenders were Pascal Siakam (33 possessions) and Danny Green (31).
- Siakam was the primary defender on Butler, who shot 12-for-19 (and more often than usual) on those possessions.
- The Sixers were one of two teams to shoot better than 70 percent in the restricted area against the Raptors. Butler, Embiid and Simmons combined to shoot 57-for-77 (74 percent) in the restricted area and 30-for-88 (34 percent) outside it.
- The 38 free throws the Sixers made (on 41 attempts) in the Feb. 5 meeting were tied for the fourth most for any team in any game this season. (The Sixers also had the three highest totals.)
- Green had an effective field goal percentage of just 37.5 percent against Philadelphia, his worst mark against any Eastern Conference opponent.
- The Raptors’ worst plus-minus against the Sixers belonged to Greg Monroe, who was a minus-29 in his 45 minutes in the season series … and now plays for Philadelphia.


