
Happy New Year! With the start of 2020, we are getting close to the midway point of the season. And with 42% of games complete through Thursday, here are some things of note as we head into the Week 11 weekend.
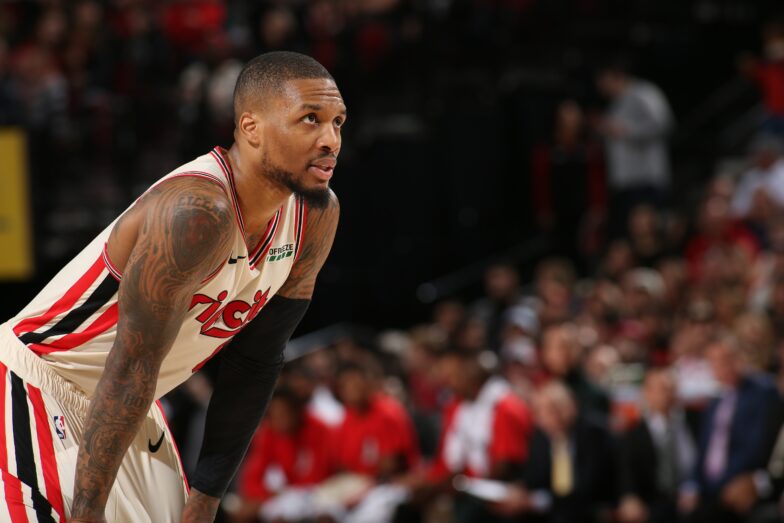
Tough times in Portland
Given their injuries and the departure of Kevin Durant, it’s not a surprise that the Golden State Warriors have seen the league’s biggest drop from last season (by a wide margin) in point differential per 100 possessions. What may be a surprise is the team that has seen the second biggest drop.
| Team | 2018-19 | Rank | 2019-20 | Rank | Diff. |
|---|---|---|---|---|---|
| Golden State | +6.5 | 2 | -7.9 | 28 | -14.4 |
| Portland | +4.2 | 7 | -2.0 | 19 | -6.2 |
| Charlotte | -1.3 | 19 | -6.8 | 26 | -5.5 |
| Atlanta | -5.5 | 26 | -10.1 | 30 | -4.6 |
| San Antonio | +1.6 | 12 | -1.4 | 17 | -3.0 |
| Through Jan. 2, 2020 | |||||
After a 5-12 start, the Portland Trail Blazers had seemingly fixed themselves with a four-week, 9-4 stretch. But only one of those nine wins (Nov. 27 vs. Oklahoma City) came against a team that’s currently over .500. And now the Blazers have lost five straight, with three of the losses coming to teams currently below .500.
The Blazers rank 22nd defensively and, though it began with an ugly, 102-94 loss to New Orleans and though three of the five opponents have below-average offenses, the losing streak has been their worst five-game stretch of defense (119.4 points allowed per 100 possessions) this season.
Portland has to hope that the nadir was their loss in New York on Wednesday, in which they allowed the Knicks’ 27th-ranked offense (which has been playing better of late) to score 117 points on 100 possessions. It’s not good when you give up four dunks on the Frank Ntilikina-Mitchell Robinson pick-and-roll…
After the Knicks got the last two of those on their final two possessions of the third quarter on Wednesday, the Blazers blitzed the Ntilikina-Robinson pick-and-roll (with Anthony Tolliver, more mobile and less of a rim protector than Hassan Whiteside) on the first possession of the fourth. Robinson caught Ntilikina’s pass at the elbow and, when met with weak-side help, kicked the ball out to an open Reggie Bullock. He then got rebounding position on the recovering Tolliver and tipped in Bullock’s miss, on his way to a perfect, 11-for-11 night from the field.
The Blazers have generally protected the rim decently. They rank fifth in opponent field goal percentage in the restricted area (58.5%). But while they rank 12th in opponent effective field goal percentage, they’re in the bottom 10 in each of the other four factors on defense: 24th in opponent free throw rate (28.3 attempts per 100 shots from the field), 28th in opponent turnover rate (12.7 per 100 possessions), and 26th in defensive rebounding percentage (having allowed their opponents to grab 29.2% of available offensive boards).
“I don’t think it’s just one thing,” CJ McCollum said Wednesday about the issues that have popped up over this five-game slide, before listing problems on just one end of the floor (even though his team just shot 39% against the Knicks). “Sometimes, it’s transition. Sometimes, there’s offensive rebounds. Sometimes, we’re fouling. It’s like there’s something new every game.”
The Blazers’ schedule is only going to get tougher. Their five-game trip continues in Washington on Friday (7 ET, League Pass). But then they visit Miami (where the Heat are 16-1) on Sunday and Toronto on Tuesday. In total, they have the league’s second toughest January schedule in regard to cumulative opponent winning percentage, with 10 of their 14 remaining games against teams currently over .500. After that loss in New York on Wednesday, the Blazers are 11-9 against teams currently under .500 and 3-12 against teams currently over .500.
The Blazers’ injuries — they’re currently without Jusuf Nurkic, Zach Collins, Skal Labissiere and Rodney Hood (done for the season) — have certainly been a factor. But their issues go beyond that, and the tough schedule wouldn’t be so daunting if they could figure out how to fix them.
“It’s frustrating,” Damian Lillard said. “You think, when you start slow, all right, it’s just the beginning. It’s going to take some time, and then you play better, and it don’t work out. And you have another rough stretch and it’s, like, ongoing.
“So that part is the most frustrating, but I think we got to be prepared for even if it’s this way, up and down the whole season. We got to make sure that we’re in it to continue to fight, because even though it’s like this, we’re in the playoff race. That’s the reason for us to keep on fighting.”
That’s the thing. At 14-21, the Blazers are just a game out of a playoff spot and tied in the win column with the eighth-place Spurs, who have an even tougher January schedule.
The two sides of pace

The team that had the No. 1 defense last season has seen the league’s sixth biggest drop in points allowed per 100 possessions. Having allowed just 101.2 per 100 through 36 games, the Milwaukee Bucks are comfortably in position to lead the league in defensive efficiency for a second straight year.
One thing the Bucks didn’t do last season is also lead the league in pace. Through Thursday, the Bucks have averaged a league-high 104.8 possessions per 48 minutes.
It’s somewhat counterintuitive to play great defense while playing fast. Over the last 23 years (since play-by-play data started being tracked in 1996), 30 teams have finished a season in the top five in both pace and offensive efficiency, but only 10 have done it in the top five in both pace and defensive efficiency. Only one, the 2014-15 Warriors, has led the league in both.
Pace isn’t just about how fast a team plays offensively, because for every offensive possession, there’s a defensive possession. And you don’t necessarily want the pace you play at offensively to be reflected on the other end of the floor.
According to Second Spectrum tracking, the league has an effective field goal percentage of 59.0% in the first six seconds of the shot clock, 52.6% in the middle 12 seconds of the shot clock, and just 43.7% in the last six seconds of the shot clock.
| Time | FG% | eFG% | %FGA |
|---|---|---|---|
| 18-24 | 51.8% | 59.0% | 14.7% |
| 12-18 | 46.5% | 53.6% | 40.7% |
| 6-12 | 44.4% | 51.2% | 30.1% |
| 0-6 | 37.7% | 43.7% | 14.5% |
| eFG% = (FGM + (0.5 * 3PM)) / FGA
%FGA = Percentage of total FGA Through Jan. 2, 2020 |
|||
The Bucks have taken 19.2% of their shots, the league’s highest rate, in the first six seconds of the shot clock. And according to Synergy tracking, 20.8% percent of their possessions, also the league’s highest rate, have been in transition. They’ve taken just 10.1% of their shots, the league’s lowest rate, in the last six seconds of the clock.
On the other end of the floor, their opponents have taken only 13.0% of their shots in the first six seconds, a rate well below the league average (14.7%). Only 14.6% of their opponents’ possessions, the league’s ninth lowest opponent rate, have been in transition. Milwaukee opponents have taken 13.7% of their shots in the last six seconds of the clock.
The Bucks play fast, while managing to keep their opponents from doing the same. That’s not an easy needle to thread, and it’s a big reason why they’re 31-5.
Another reason is that they’ve played one of the league’s easiest schedules. But they’ve taken care of business, going 22-0 against the 17 teams currently under .500. They’re playing 11 of their 13 January games against that group, and their next two are a home-and-home set with the Spurs, Saturday in Milwaukee (8:30 ET, League Pass) and Monday in San Antonio (8:30 ET, League Pass).
TCB rankings
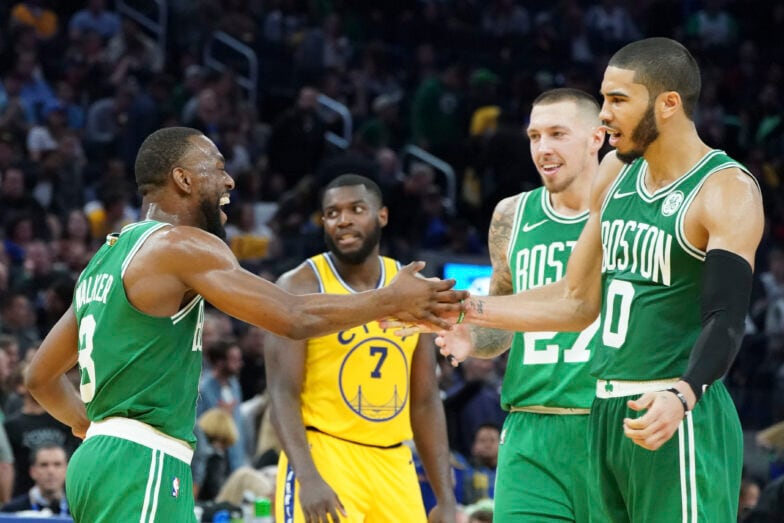
The Bucks aren’t the only team who has taken care of business. The 13 teams currently over .500 are 215-44 against the 17 teams currently below .500, with the Lakers (18-0) and Raptors (18-0) also undefeated against the bottom 17.
| Team | GP | Wins | Losses | Win% | Pt. Diff. |
|---|---|---|---|---|---|
| Milwaukee | 22 | 22 | 0 | 1.000 | +17.8 |
| L.A. Lakers | 18 | 18 | 0 | 1.000 | +12.6 |
| Toronto | 18 | 18 | 0 | 1.000 | +13.3 |
| Boston | 18 | 16 | 2 | 0.889 | +11.7 |
| Utah | 20 | 17 | 3 | 0.850 | +7.7 |
| Miami | 19 | 16 | 3 | 0.842 | +9.2 |
| Dallas | 20 | 16 | 4 | 0.800 | +13.2 |
| LA Clippers | 19 | 15 | 4 | 0.789 | +12.7 |
| Denver | 22 | 17 | 5 | 0.773 | +5.8 |
| Philadelphia | 20 | 15 | 5 | 0.750 | +6.4 |
| Houston | 22 | 16 | 6 | 0.727 | +7.9 |
| Indiana | 21 | 15 | 6 | 0.714 | +5.3 |
| Oklahoma City | 20 | 14 | 6 | 0.700 | +3.3 |
| TOTAL | 259 | 215 | 44 | 0.830 | +9.7 |
| Through Jan. 2, 2020 | |||||
The Lakers play their next three games against the bottom 17, but they host the Pelicans on Friday (10:30 ET, ESPN), and New Orleans comes to L.A. with a four-game winning streak. The Raptors play their next four against teams with losing records, but the shorthanded champs are in Brooklyn on Saturday, with the Nets just having fell below .500 and reportedly set to get Caris LeVert back from a 24-game absence.
What’s a double-digit lead these days?
A couple of weeks ago, the Raptors came back from 30 points down in the third quarter to beat the Mavs. It was the first time in 10 years that a team won a regular season game it trailed by at least 30 points. The Clippers also came back from 31 down to beat the Warriors in Game 2 of their first-round series last year.
Two 30-point comebacks in 10 years is not quite a trend. But there’s a prevailing thought that a double-digit lead ain’t what it used to be, because of the increase in 3-point shooting and the volatility that comes with it.
This is the ninth straight season in which the league has seen increase in the percentage of its shots that have come from 3-point range. That number is 38%, up from 36% last season and 22% in 2010-11.
And indeed, a double-digit lead isn’t as safe as it was nine years ago. This season, teams have won 75.0% of the games they’ve led by 10 points or more. That’s the lowest mark of the last 10 seasons, down from 78.4% in ’10-11. Just on Thursday, six different teams — Brooklyn, Chicago, Cleveland, Indiana, Memphis and San Antonio — lost games that they led by double-digits.
But Thursday was a rare night, and the drop in overall winning percentage after leading by double-digits is not a huge dip. There hasn’t been a drop with every season, as has been the case with the 3-point-rate increase.
| Season | 3PA% | 10+ | 15+ | 20+ |
|---|---|---|---|---|
| 2009-10 | 22.2% | 0.774 | 0.897 | 0.967 |
| 2010-11 | 22.2% | 0.784 | 0.900 | 0.963 |
| 2011-12* | 22.6% | 0.795 | 0.913 | 0.975 |
| 2012-13 | 24.3% | 0.775 | 0.904 | 0.963 |
| 2013-14 | 25.9% | 0.786 | 0.899 | 0.966 |
| 2014-15 | 26.8% | 0.789 | 0.911 | 0.969 |
| 2015-16 | 28.5% | 0.794 | 0.896 | 0.967 |
| 2016-17 | 31.6% | 0.758 | 0.885 | 0.967 |
| 2017-18 | 33.7% | 0.769 | 0.876 | 0.946 |
| 2018-19 | 35.9% | 0.770 | 0.864 | 0.946 |
| 2019-20 | 37.9% | 0.750 | 0.864 | 0.952 |
| 3PA% = 3PA / FGA
Bold = Highest %. Italics = Lowest % * Lockout-shortened season Through Jan. 2, 2020 |
||||
These numbers don’t account for a team losing a 10, 15 or 20-point lead and still winning the game. They’re solely about the final result. And one game (in which both teams held leads of 10, 15 or 20) could be accounted for twice in the numbers above.
Still, a double-digit lead remains meaningful. This season, every team but one — the 6-7 Atlanta Hawks — has a winning record after holding a double-digit lead.
Posting to pass

There’s been a lot of talk about post-ups recently. After the Inside the NBA crew said that Kristaps Porzingis should post up more, Mavericks coach Rick Carlisle answered by saying that “the post-up isn’t a good play anymore.”
According to Synergy play-type tracking, Joel Embiid (1.14) and Andre Drummond (1.01) are the only players who have averaged a point per possession on at least three post-ups per game. Porzingis, meanwhile, has scored just 0.57 points per possession on post-ups, the worst mark (by a healthy margin) among 30 players who have averaged at least two post-up possessions per game, according to Synergy.
The post-up isn’t entirely dead, however. And while guys like Embiid and LaMarcus Aldridge post-up to score, others use the post-up to make plays.
According to Second Spectrum tracking (which includes post-ups that don’t end with a shot, free throw or turnover), 29 players have posted up at least three times per game. Three of those 29 have passed more than 50% of of the time…
- Draymond Green – 56.1%
- Ben Simmons – 55.7%
- LeBron James – 52.5%
On the other end of the list, three players have passed less than 20% of the time they’ve posted up…
- Carmelo Anthony – 9.1%
- Montrezl Harrell – 9.6%
- Andre Drummond – 16.3%
It’s an interesting list in regard to both ends of it.
* * *
John Schuhmann is a senior stats analyst for NBA.com. You can e-mail him here, find his archive here and follow him on Twitter.
The views on this page do not necessarily reflect the views of the NBA, its clubs or Turner Broadcasting.


